Technology | Jul 01, 2026
Discover Weincloud’s Key New Features
Released in early 2026, Weincloud V1.5 brings more efficient management capabilities and practical new features to HMI cloud services. This article highlights the key Dashboard and EasyAccess 2.0 updates in Weincloud that you won’t want to miss.
Register for Weincloud now and start your 3-month free trial!

Dashboard Updates
1. Map View: View HMI Locations on a Map (EasyAccess 2.0 activation required)
Managing devices across countries, factories, or sites can make it difficult to locate the right HMI in a long device list. The new Map View displays all HMI devices with location coordinates set under the selected Domain, helping managers quickly understand the geographic distribution of their equipment.
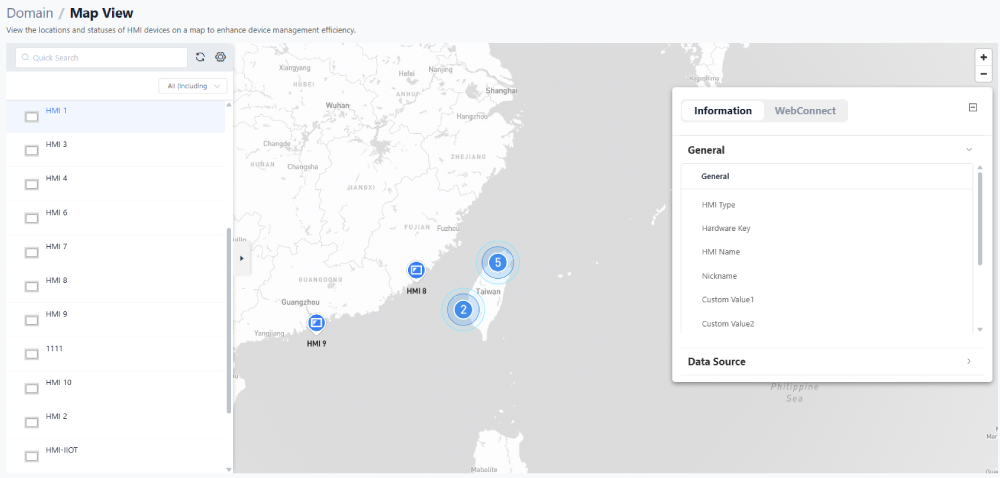
Click any HMI icon on the map to open a details panel on the right, which includes:
● Information: Basic HMI identification data, including model, name, status, and more.
● WebConnect: Start a remote connection directly from the map interface.
2. View HMI Screen Directly in a Project (EasyAccess 2.0 activation required)
A new View HMI Screen widget has been added to the Dashboard project design area. Powered by WebConnect technology, it embeds WebView or WebVNC screens within a dashboard. When unusual data is detected, on-site machine status can be checked within the same project without switching platforms or opening another app.
3. Data API: Reuse Data for Advanced Applications
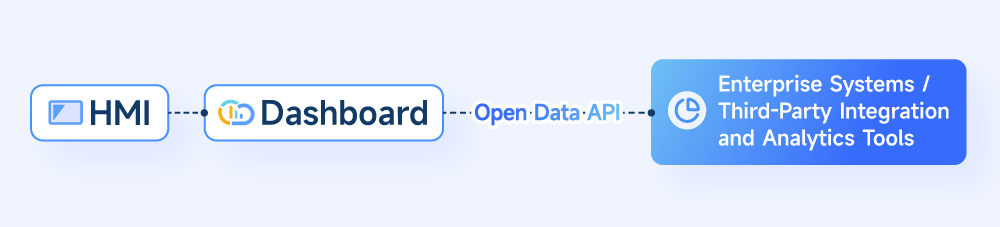
Dashboard introduces Open Data API support. Real-time, historical, and alarm tag data from HMIs can be integrated with enterprise systems or professional analytics tools such as Power BI and Grafana, enabling more advanced analysis of factory equipment operations.
Read the technical documentation to learn how to create a Data API.
4. Analyze Data: View Specific Tag Data
Analyze Data supports two display modes: Trend Display and Tag History. Up to five tags can be compared and analyzed at the same time, making specific HMI tag data easier to understand. In the History tab under Trend Display, click the gear icon in the upper-right corner to enable Aggregate Mode. This generates charts by time unit, making data trends easier to observe without creating a Dashboard project.
For detailed instructions, refer to the Analyze Data documentation.
5. Smart Report: AI-Powered Analysis Results
With the new AI Smart Report feature, simply select a target HMI and generate a report with one click. Based on the HMI name, tags, and prompt, AI automatically creates a visual report to support project improvements and future decision-making.
For detailed instructions, refer to the Smart Report – Quick Start documentation.
EasyAccess 2.0 Updates
1. Event Webhook Notifications
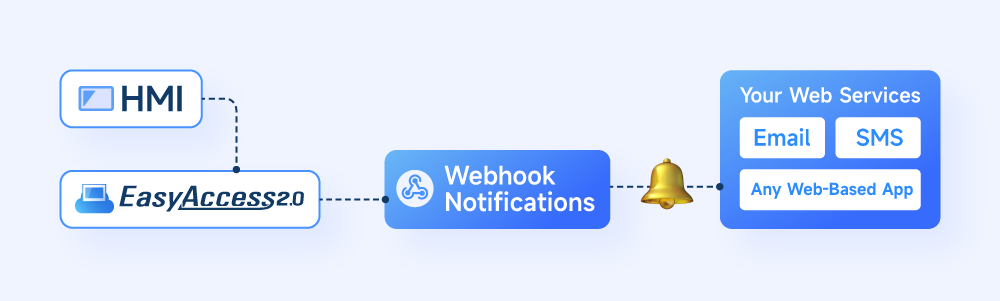
EasyAccess 2.0 now supports Webhooks alongside its existing notification options. By creating a Webhook and configuring a custom URL endpoint, HMI events can be sent to web-based enterprise systems or third-party communication platforms such as LINE, Microsoft Teams, and Slack. This provides a more flexible and reliable notification method while reducing the risk of disruption caused by platform service discontinuation.
Webhooks also support a wide range of applications. Events can be forwarded to an in-house operations and maintenance platform or a ticketing system such as Jira, allowing work orders to be created automatically when equipment issues occur. Alarm events can also be sent to an AI agent, enabling immediate troubleshooting suggestions when an issue is detected.
Read the technical documentation to learn how to create a Webhook.
2. Command Line Interface (CLI)
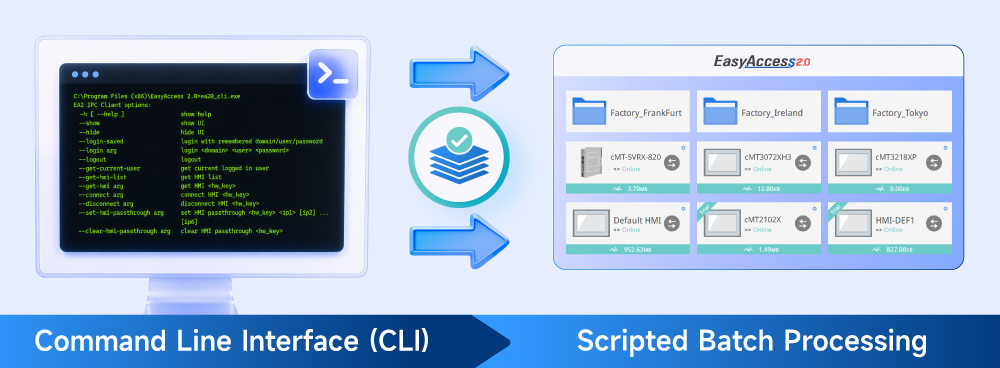
When managing dozens or even hundreds of HMIs in a factory, repetitive tasks such as project updates and VPN connections can require significant manual effort. The Command Line Interface (CLI) makes EasyAccess 2.0 easier to operate through scripts. Tasks such as project upload and download, backup, and pass-through configuration can be processed automatically in batches by running scripts. This reduces maintenance effort and saves valuable engineering time.
Read the technical documentation to learn how to enable CLI.
In addition to the key updates above, Weincloud V1.5 brings a range of enhancements, such as custom Dashboard canvas sizes, an optimized mobile viewing interface, runtime tag adjustment, and a dedicated management interface for social accounts.
Want to learn more? View the Weincloud V1.5 release notes for the complete update guide.